

🎉 R Data Science Digest November 2021
🎉 R Data Science Digest November 2021
A thematic list of R posts, packages and tools that were popular in the last month

A list of the most popular posts featured on R Posts you might have missed! in September and October 2021. All of the most exciting R resources in visualisation, data analysis and lots more!
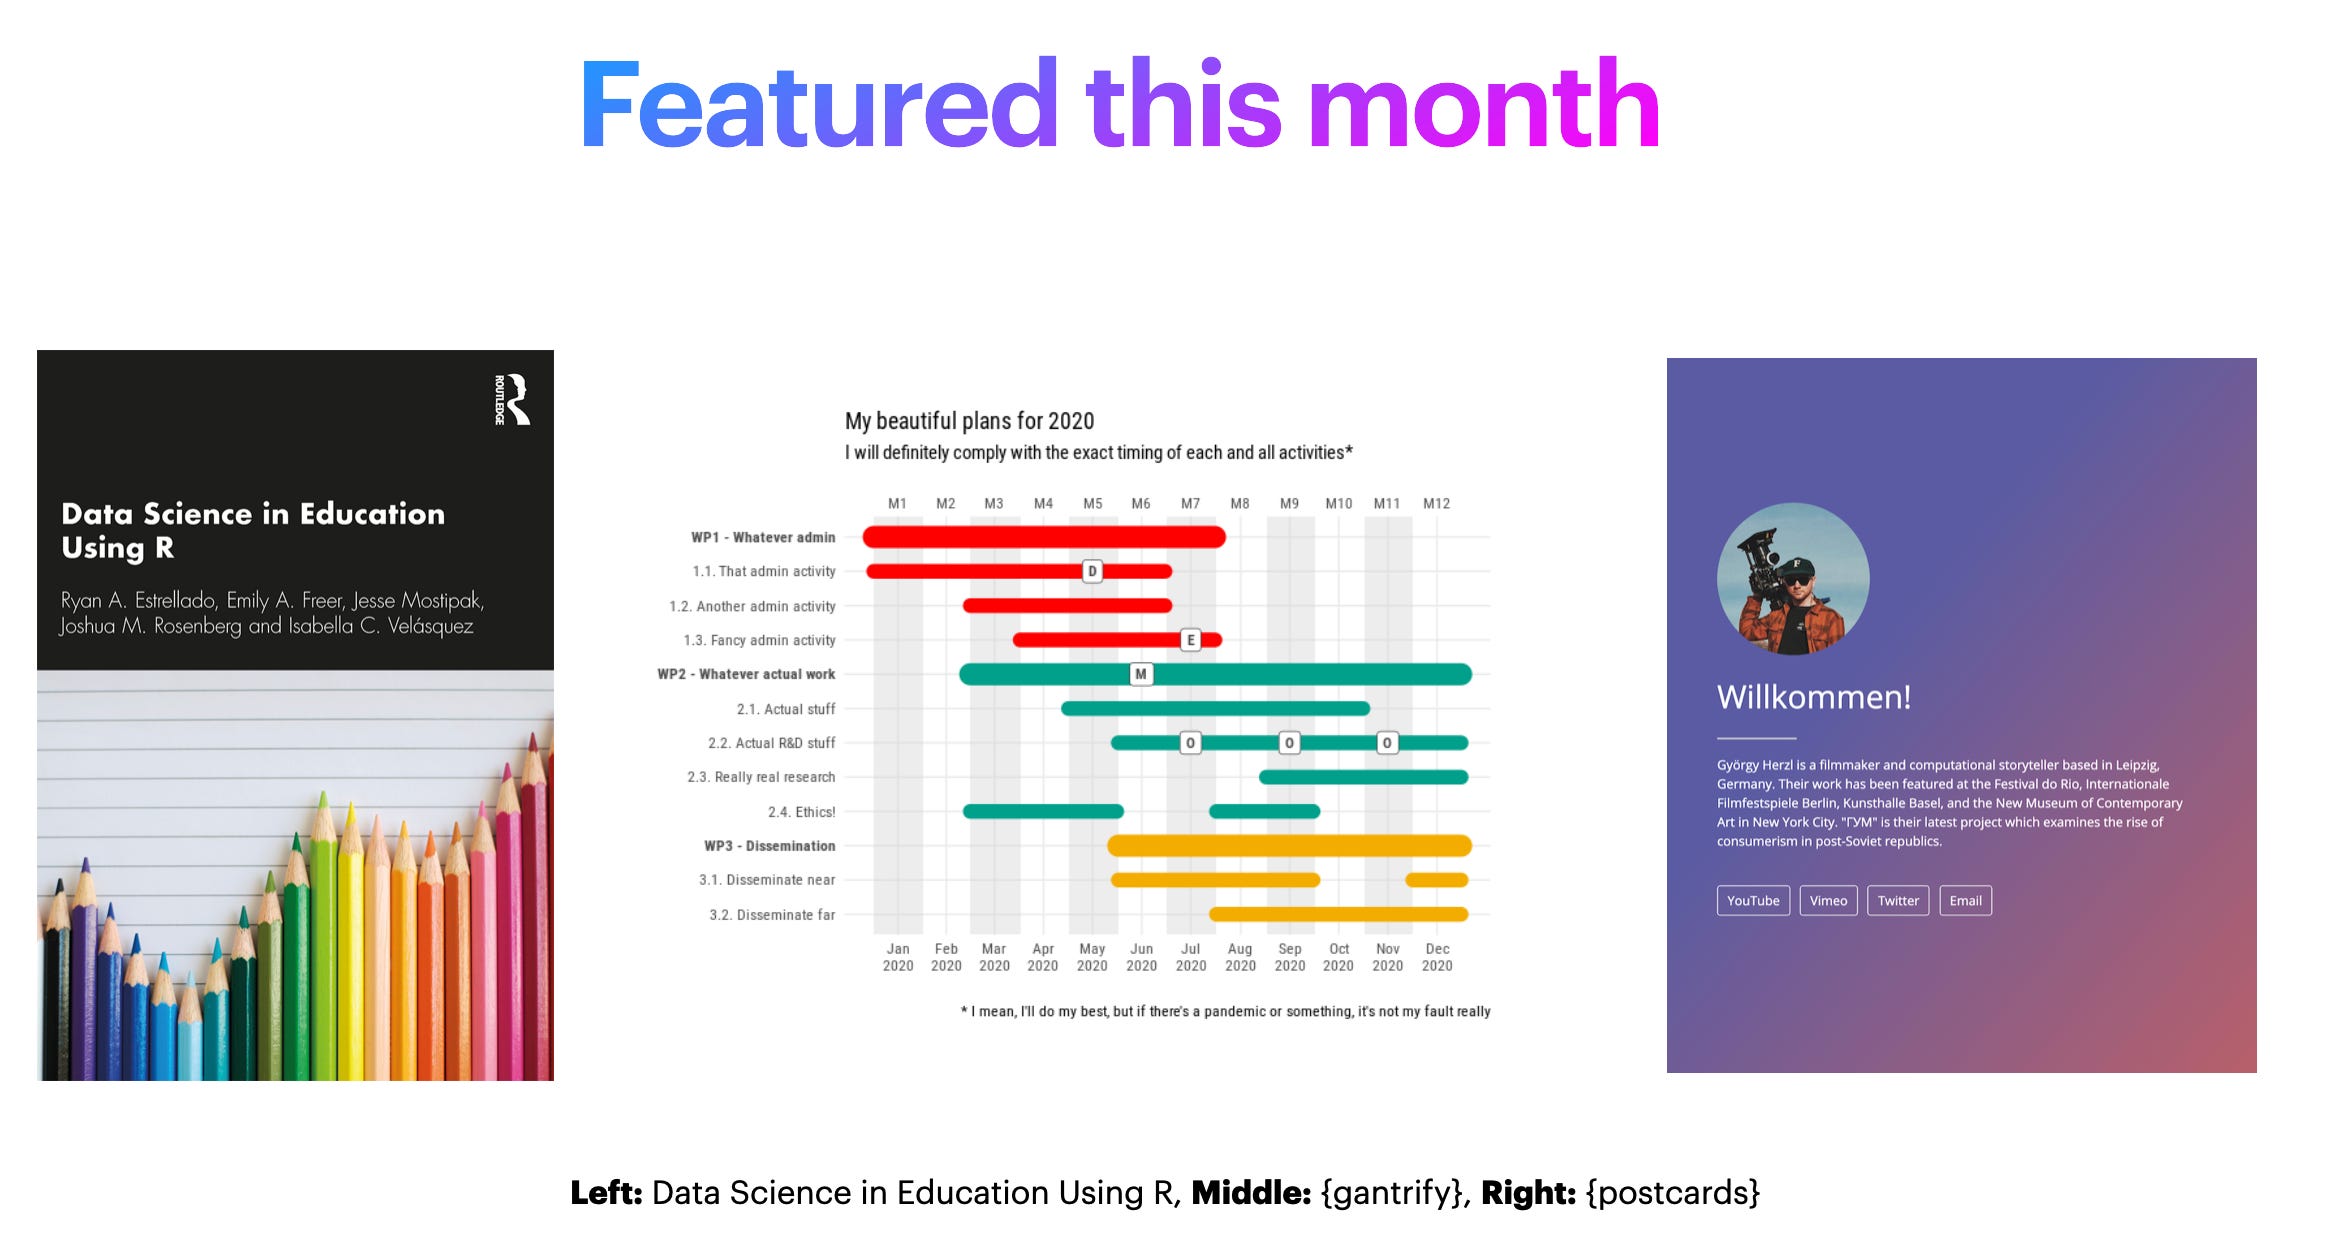
📦 postcards • Create simple, beautiful personal websites and landing pages using only R Markdown. by Sean Kross.
📚 Data Science in Education Using R by Ryan A. Estrellado, Emily A. Bovee, Jesse Mostipak, Joshua M. Rosenberg and Isabella C. Velásquez.
📦 {ganttrify} • Create beautiful Gantt charts with ggplot2 by Giorgio Comai.
📊 Visualisation: {ggplot2} extensions
📦 {ggalt}: Make a Dumbbell Plot to Visualize Change in ggplot2 by Matt Dancho.
📦 {ggthemeassist} • A RStudio addin for ggplot2 theme tweaking by Calli Gross and Philipp Ottolinger.
📦 {patchwork} • The Composer of ggplots. makes it ridiculously simple to combine separate ggplots into the same graphic. by Thomas Lin Pedersen.
📦 Adding dogs to ggplot2 with {ggdogs} by R CODER.
📦 {ggside} • ggplot2 extension allowing for plotting various geometries as side panels using the ggplot2 API by Justin Landis.
📦 {pilot} • A minimal ggplot2 theme with an accessible discrete color palette. by Oli Hawkins.
📦 Sankey diagrams in ggplot2 with {ggsankey} by R CODER.
📦 {ggHoriPlot} • A user-friendly, highly customizable R package for building horizon plots in the {ggplot2} environment. by Iker Rivas-González.
📦 {ggdist} • Visualizations of distributions and uncertainty by Matthew Kay.
🎨 {wesanderson} • A Wes Anderson color palette for R by Karthik Ram and Hadley Wickham.
📊 Visualisation: guides and tutorials
✍️ Sexy up your logistic regression model with logit dotplots by Solomon Kurz.
✍️ Explore Your Dataset in R — Little Miss Data by Laura Ellis.
✍️ Creating Beautiful Data Visualizations in R: a ggplot2 Crash Course by Dr. Sam Tyner.
💡 10 Tips to Customize Text Color, Font, Size in ggplot2 with element_text() by cmdline tips.
✍️ Exploring ggplot2 boxplots - Defining limits and adjusting style - Water Data For The Nation Blog by Laura DeCicco.
✍️ Animating Network Evolutions with gganimate by David Schoch.
🎓 {ggplot2} Teaching Material – Collection of teaching materials for the R package ggplot2. by Cédric Scherer.
✍️ Circular barplot with R and ggplot2 – the R Graph Gallery by Tomas Capretto, Tobias Stalder and Yan Holtz.
📚 Data Visualization with R by Rob Kabacoff.
Statistics
Bayes
📦 {brms} • brms R package for Bayesian generalized multivariate non-linear multilevel models using Stan by Paul Bürkner.
🎓 Bayesian statistics resources by Andrew Heiss.
🎓 Bayesian statistics with R by Olivier Gimenez.
🎓 rethinking • Statistical Rethinking course and book package by Richard McElreath.
Causal inference
🎓 Causal Inference in R Workshop by Lucy D’Agostino McGowan Malcolm Barrett.
🎓 causal_salad_2021 • One day course on causal inference, MPI-EVA 9 September 2021 by Richard McElreath.
General
📚 Introduction to Modern Statistics by Mine Çetinkaya-Rundel and Johanna Hardin.
A Gentle Introduction to Tidy Statistics in R by Tom Mock.
📚 Beyond Multiple Linear Regression: Applied Generalized Linear Models and Multilevel Models in R by Paul Roback and Julie Legler.
✍️PCA with tidyverse by Benjamin Nowak.
✍️ Principal Component Analysis (PCA) by Helen Yan and Bayes' Baes.
📦 {marginaleffects} • An R package to compute marginal effects, adjusted predictions, contrasts, and marginal means for a wide variety of models by Vincent Arel-Bundock.
✍️ Survival Analysis in R: This tutorial provides an introduction to survival analysis, and to conducting a survival analysis in R. by Emily Zabor.
✍️ What is ANOVA and how to do it with R by Jose M Sallan.
✍️ Tidymodels, interactions and anova - a short tutorial by Thomas Van Hoey.
📦 {gratia} • An R package for working with generalized additive models by Dr Gavin Simpson.
📚 Doing Meta-Analysis with R: A Hands-On Guide by Mathias Harrer, Pim Cuijpers, Toshi Furukawa and David D. Ebert.
Markdown and publishing
Websites & presentations
📦 {rolldown} • R Markdown output formats for storytelling by Yihui Xie.
📚 RMarkdown for Scientists by Nicholas Tierney.
✍️ A non-technical guide on making a personal academic website for free by Dan Quintana.
📦 {sketch} • Creates static / animated / interactive visualisations embeddable in R Markdown documents. by Chun Fung Kwok.
Tables
📚 Using the {flextable} R package by David Gohel.
💡 The Mockup Blog: 10+ Guidelines for Better Tables in R. Make tables people ACTUALLY want to read. by Tom Mock.
✍️ Riding tables with {gt} and {gtExtras} by Benjamin Nowak.
✍️ Stargazer: A solution to produce amazing academic tables by Ignacio Riveros Godoy.
✍️ Las 5 librerías de R para hacer tablas by El arte del dato bien contado.
Utilities
✍️ An Introduction to Docker for R Users by Colin Fay.
✍️ Connecting Shiny with Google Drive: Sheets by Jonathan Trattner.
📦 {tidylog} • provides feedback about dplyr and tidyr operations. It provides wrapper functions for the most common functions, such as filter, mutate, select, and group_by and joins by Benjamin Elbers.
📦 {livecode} • an R package that enables you to broadcast a local R (or any other text) document over the web and provide live updates as it is edited. by Colin Rundel.
📦 officeverse: reporting from R with the packages {officer}, {officedown}, {flextable}, {rvg} and {mschart}. by David Gohel.
📦 {grateful} • Facilitate citation of R packages by Francisco Rodriguez-Sanchez.
✍️ Working with Google Sheets from R by Jonathan Trattner.
Time series
📦 {roll} • Fast and efficient computation of rolling and expanding statistics for time-series data. by Jason Foster.
✍️ Detecting time series outliers by Rob J Hyndman.
Spatial analysis and mapping
📚 Geospatial Health Data: Modeling and Visualization with R-INLA and Shiny by Paula Moraga.
✍️ Mapping in ggplot2 and R - bivariate maps • mapping two categorical variables by Koen Hufkens.
📦 {terrainr}: Spatial Data Access and Visualization in R by Mike Mahoney.
📦 {sfnetworks} • Tidy Geospatial Networks in R by Luuk van der Meer, Lorena Abad, Andrea Gilardi and Robin Lovelace.
📦 {qgisprocess} • Use ‘QGIS’ Processing Algorithms by Dewey Dunnington and Jan Caha.
✍️ Autocorrelation in spatial regression with Random Forest by Blas M. Benito.